



Validation · Division I pilot
Movement quality drives performance. We proved it on the floor.
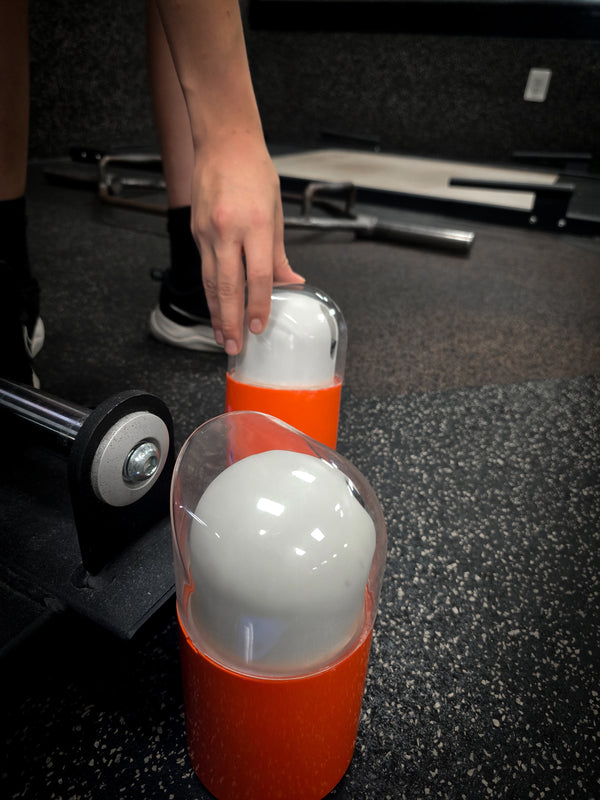
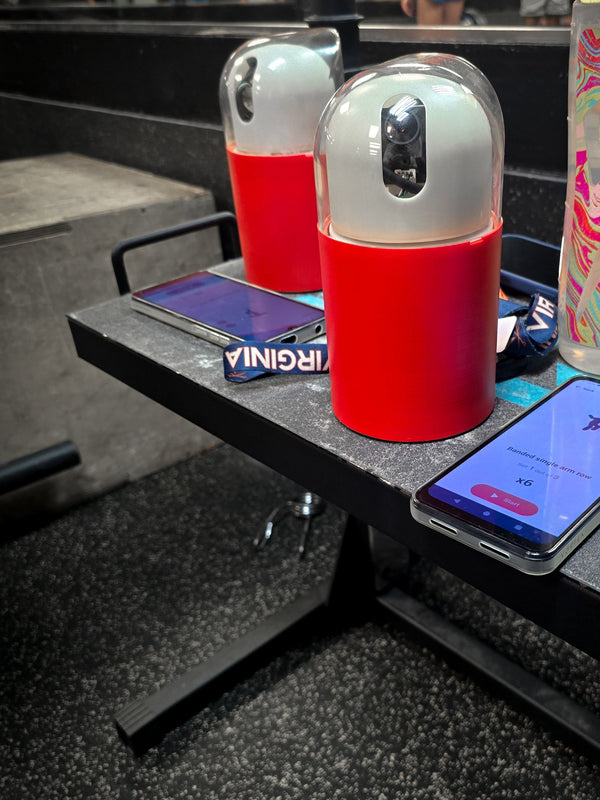
bodbx is a portable computer-vision device that measures athletic movement quality and links it to performance outcomes. We deployed it inside a Division I Olympic-sports S&C program to analyze dryland movement and relate it to performance under fatigue, three lift sessions a week across two deployment periods.
Core finding
Higher hinge quality, roughly half the fatigue.
Hinge movement quality predicted fatigue resistance
Athletes scoring 75–85 on hinge mechanics showed ~4–8% performance drop-off across repeated efforts. Athletes at 55–65 showed ~8-15%, about double the fatigue accumulation, and consistent across sessions.
Hinge score vs. fatigue drop-off
Preliminary D1 mid-distance dataEach point is an athlete. Higher hinge quality → lower fatigue drop-off, lining up with pacing and late-set performance in the water.
What the staff saw
It matched the eye. Then went further.
Movement scores aligned closely with what experienced coaches already saw intuitively, establishing trust in the measurement.
The system surfaced individual differences that are difficult to track consistently by eye, athlete by athlete.
Regression analysis helped identify which movements mattered most for which athlete.
This could really change the game. The gold is in the regression linking.Division I Strength & Conditioning Coach · has worked with Olympic-level athletes
This is fascinating, some of the correlations were not what I would've expected, but your recommendations for the next phase are supported, and I concur with them.Swim Coach, Virginia
The coaching cues are especially helpful and show how this can be applied in a program like ours.Joel Thomas, USA Swimming coach
The dashboard
What the regression looks like in practice.
Movement score on the x-axis, 100 Free time on the y-axis. R² = 0.88 across five sessions. The dashboard surfaces this correlation automatically for every athlete.

How bodbx measures movement
Joint-level motion vs. a trained reference
bodbx captures joint-level motion and compares each rep against trained reference models to quantify movement quality. Deviations in mid-phase and end-range correspond to reduced movement efficiency. That is the exact moment a cue can fix.
Hinge-based movements (RDL, hip thrust, good-morning family) produce the clearest, most consistent signal. Breakdowns tend to occur mid-rep and at end-range, and athlete-specific patterns hold across sessions.
Depth Drop, Left Shoulder
Separation through the absorption phase and end-range = lost efficiency, and a clear cueing target.
In the field
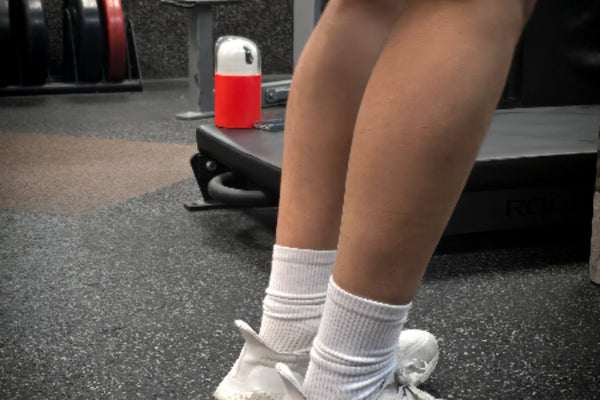
Two deployment phases inside a D1 weight room.
Note: figures reflect preliminary pilot data and are directional. n is small and analysis is ongoing; the next phase expands the dataset and refines movement-to-performance models. Program identity and staff names withheld pending public-use permission; results shown are anonymized.
Want to run the next pilot?
We're expanding to more collegiate and club programs. Bring your roster, we'll bring the measurement.
Book a demo